Generate Venn diagrams easily
I find myself generating Venn diagrams quite often. While there are many available Venn diagram plotting libraries available, they don’t always fit my need. My inputs of the diagram are the set sizes rather than lists of observations. And after drawing the Venn diagram, I often edit them to integrate with other figures, so I prefer a vector format like SVG, which not all the libraries offer.
So I made an Observable Notebook that allows me to interactively modify the Venn diagram, and download the output as a SVG file. It’s built on the venn.js library, which does all the heavy lifting.
Here is the screenshot of the diagram drawing interface (see it live on the notebook):
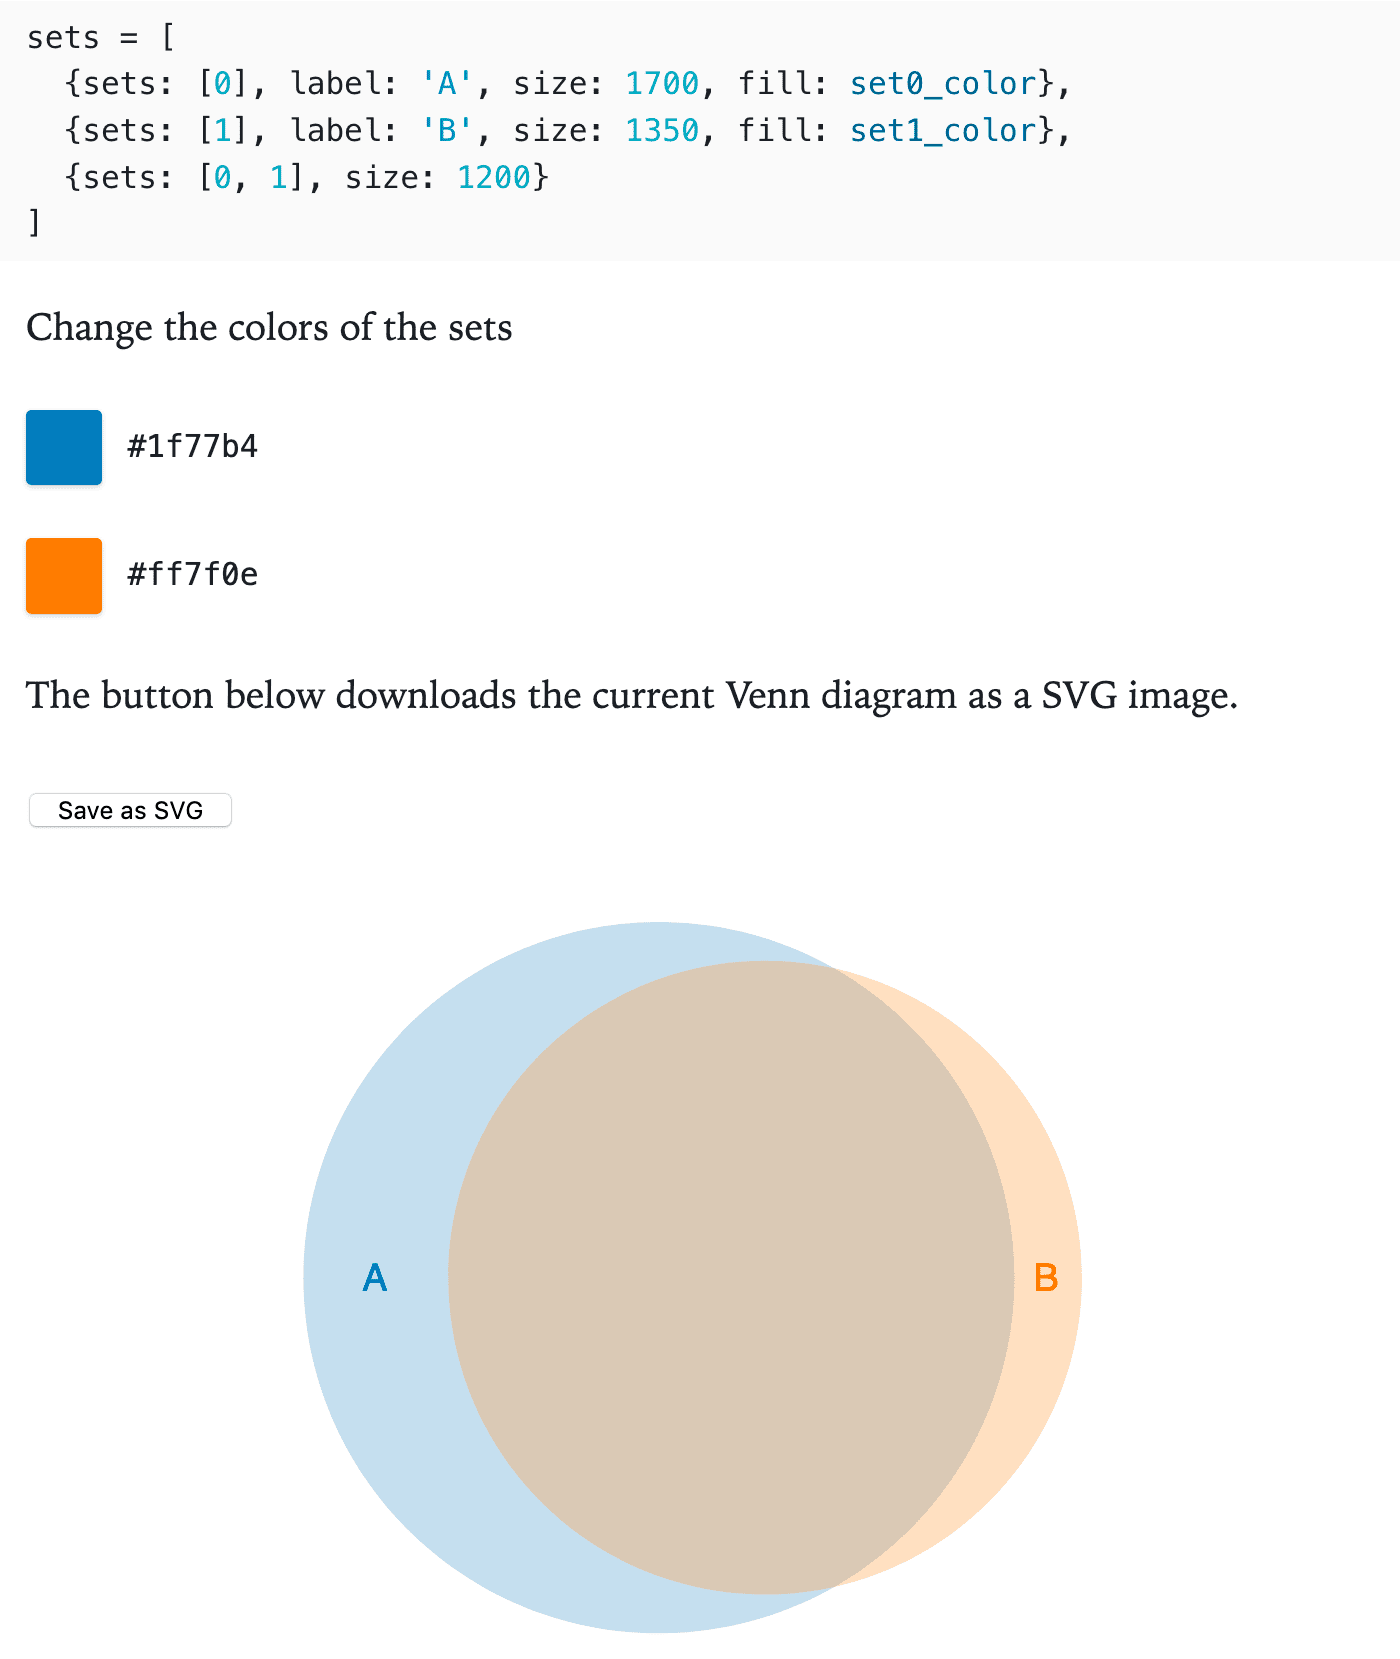
The set sizes can be easily tweaked by editing the sets variable. The colors of the two sets can be configured by clicking on the color blocks. There is a button to download the generated Venn diagram. Finally, everything changes will interactively reflect on the diagram.
What’s more cool about the Observable Notebook is I can simply modify the code to change the output. If I want to a new set to have a three-way Venn diagram, I just need to update the sets. For example, copy paste the following to the notebook:
sets = [
  {sets: [0], label: 'A', size: 1700, fill: set0_color},
  {sets: [1], label: 'B', size: 1350, fill: set1_color},
  {sets: [2], label: 'C', size: 700, fill: 'green'},
  {sets: [0, 1], size: 1200},
  {sets: [0, 2], size: 500},
  {sets: [1, 2], size: 450},
  {sets: [0, 1, 2], size: 350}
]
And I will get the following new Venn diagram in SVG:

I hope now I will spend less time figuring out how to draw a Venn diagram.