Foxconn, 2014-06-25
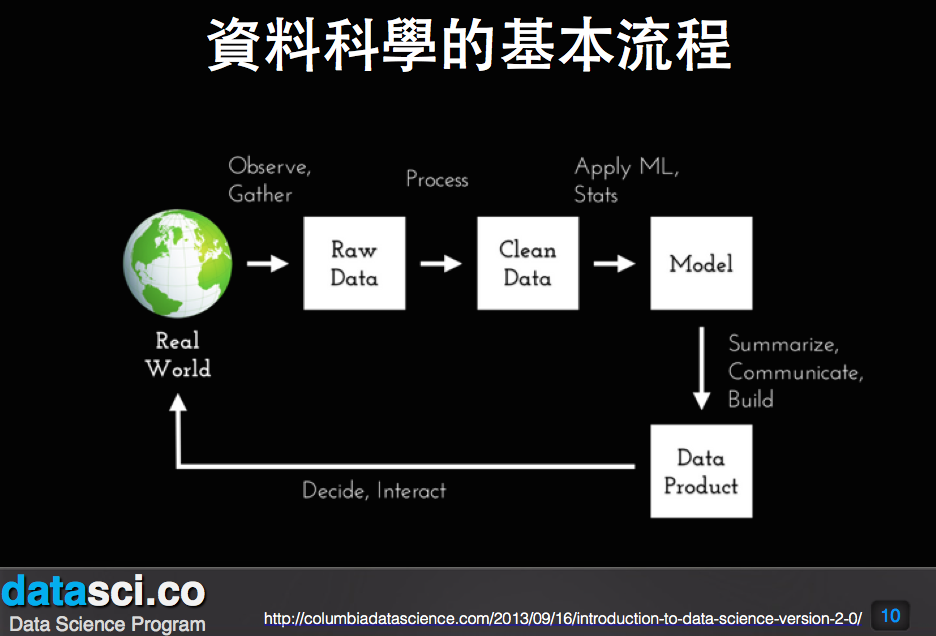
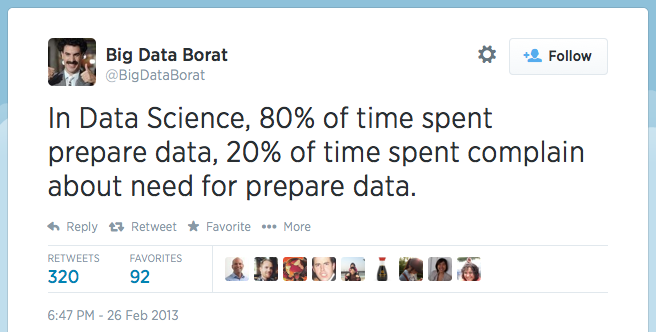
Data Science Introduction
R/Python/Vis
Esc to overview
← → to navigate
Esc to overview
← → to navigate


This part is heavily adapted from Johnson's talk in DSP.


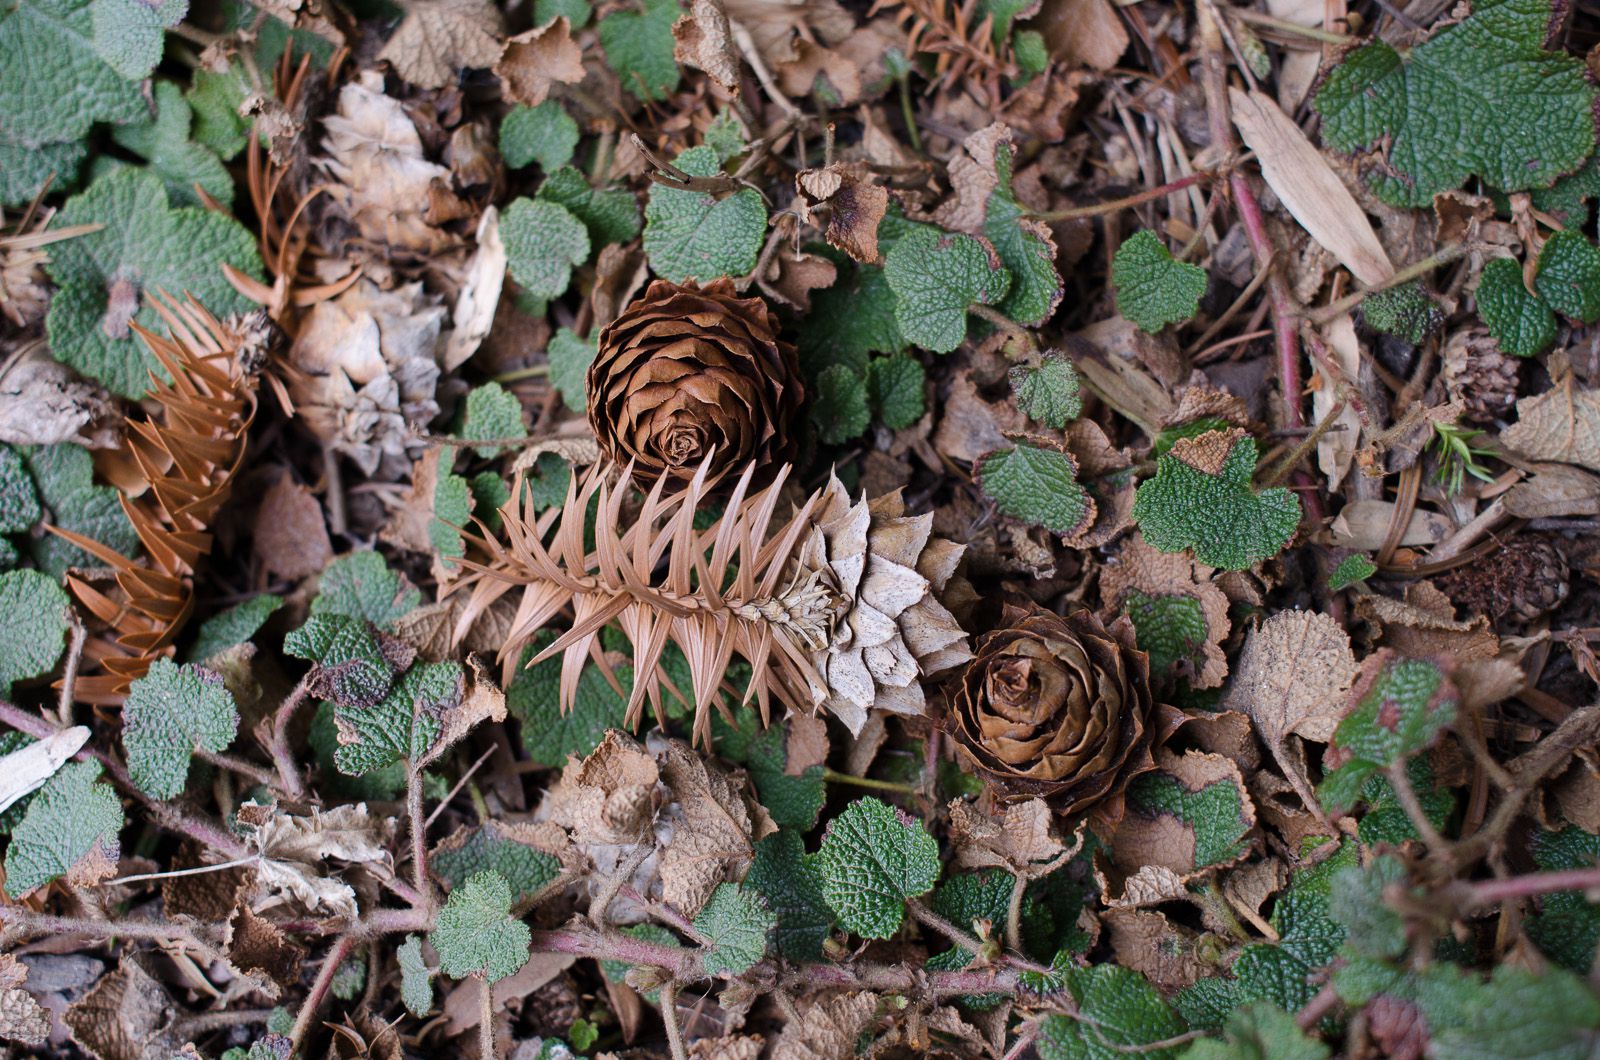
What can you find from this helicop for car chasing video?
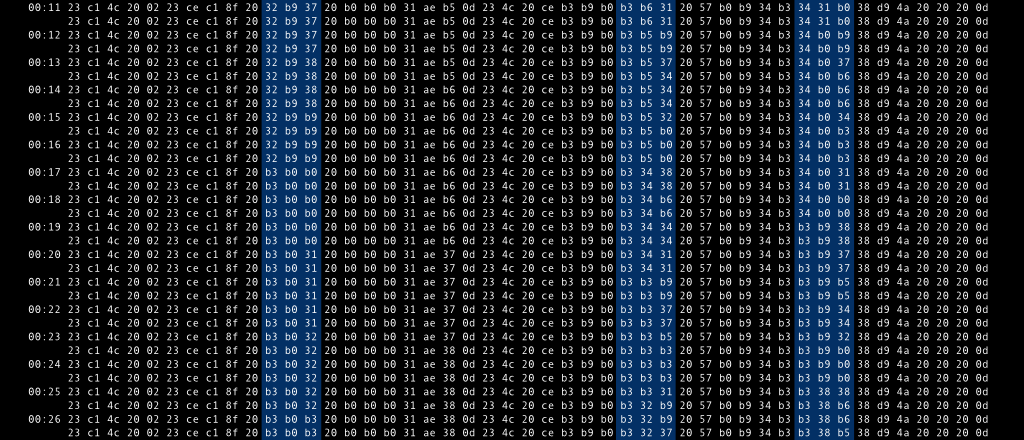
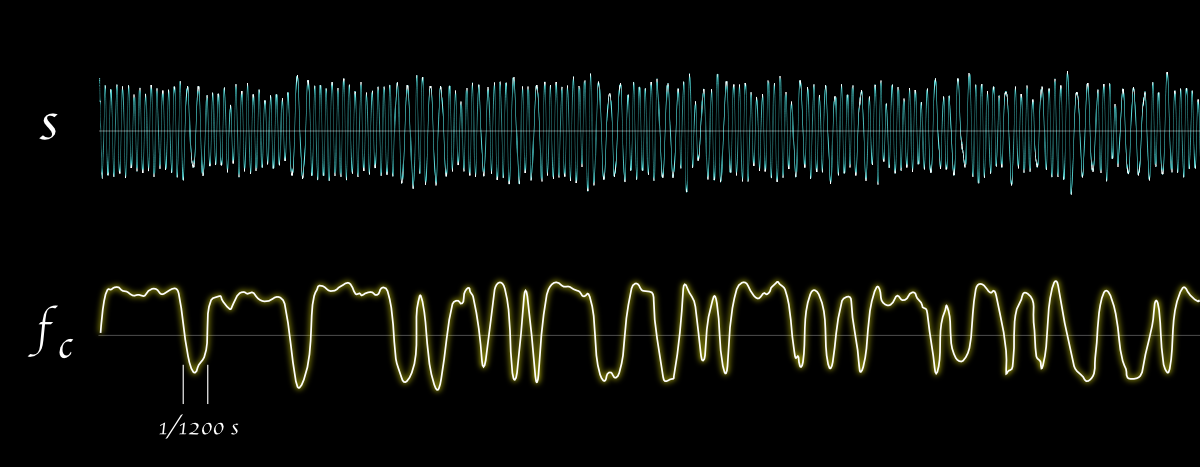
The wave pattern turns out to be some data coding, with most part repeating. Location? Video timestamp? Camera direction?
From http://www.windytan.com/2014/02/mystery-signal-from-helicopter.html
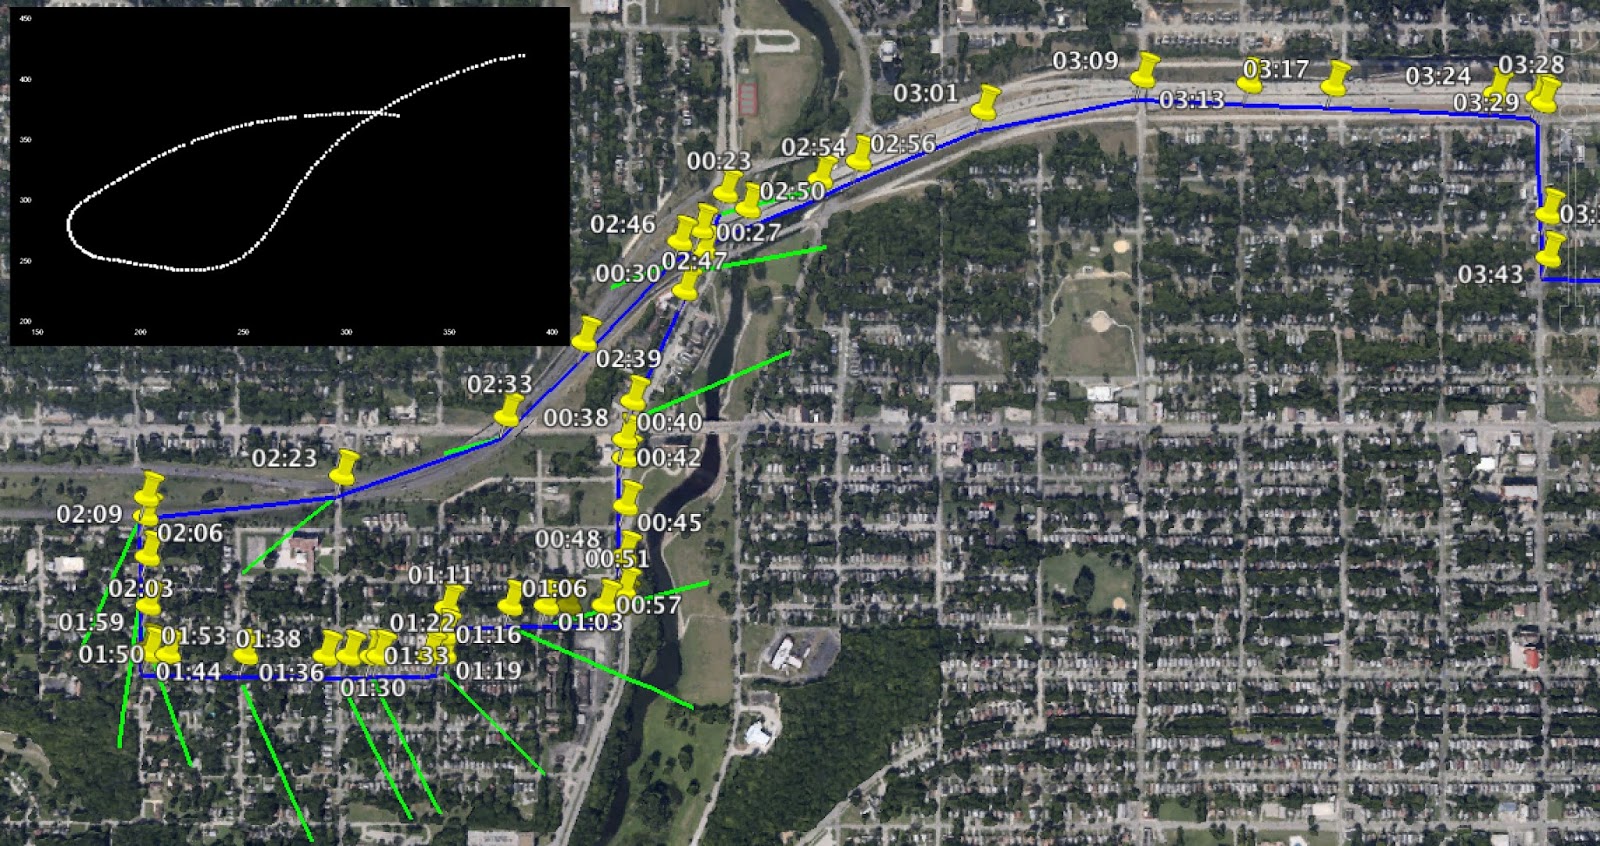
Map full trace on map. Later decodes into exact GPS locations
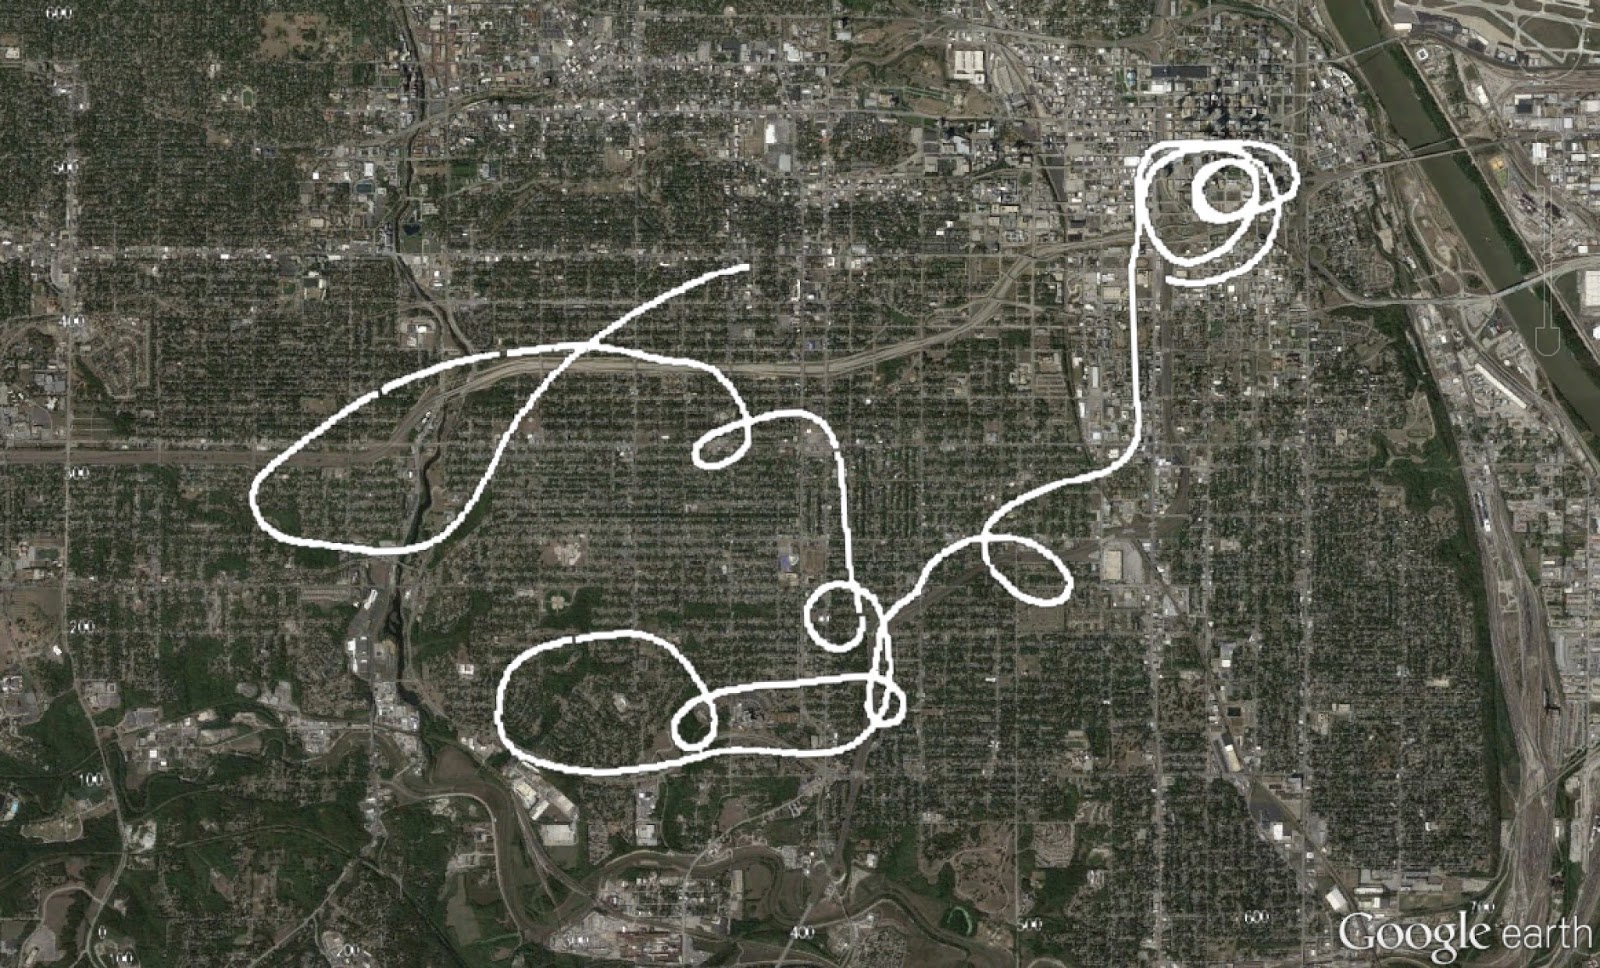
From http://www.windytan.com/2014/02/mystery-signal-from-helicopter.html
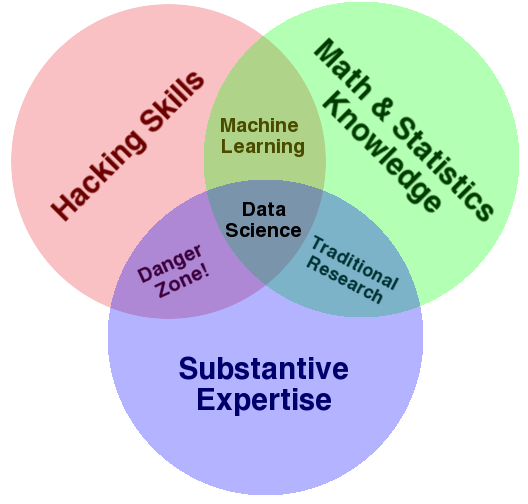
From http://drewconway.com/zia/2013/3/26/the-data-science-venn-diagram
And best place to learn data science as well
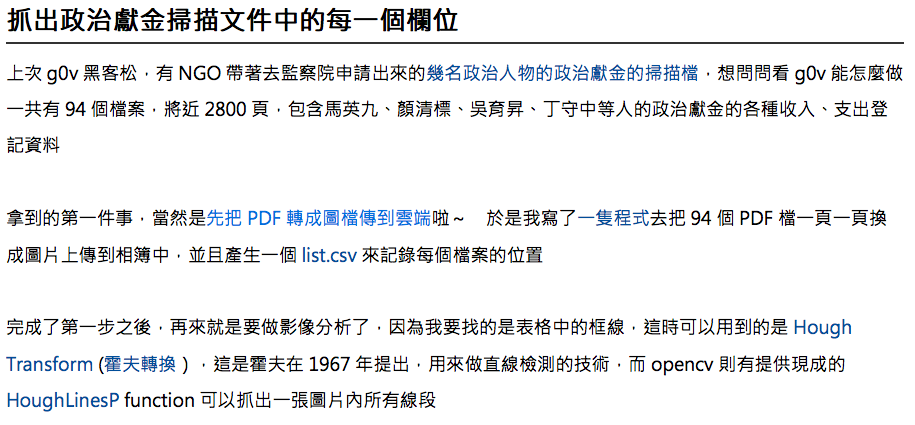
Check out http://g0v.tw/

Using Hough Transform in OpenCV
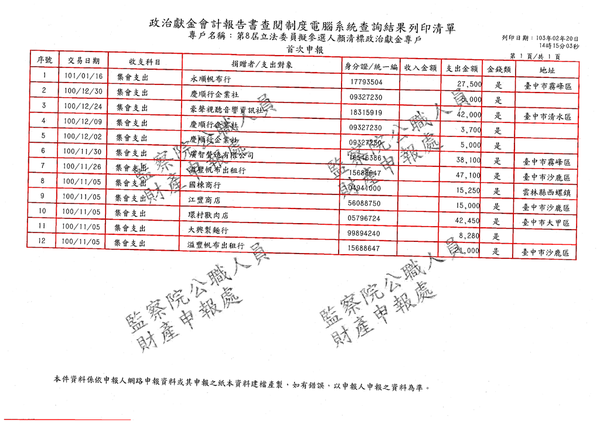
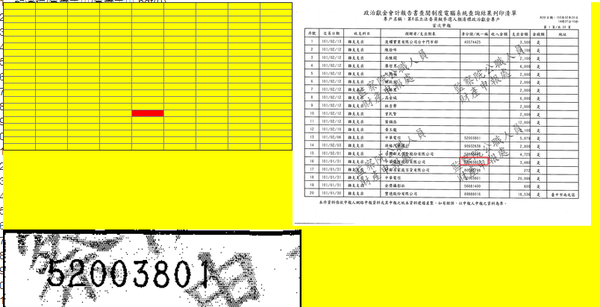
Divide the table by separate cells
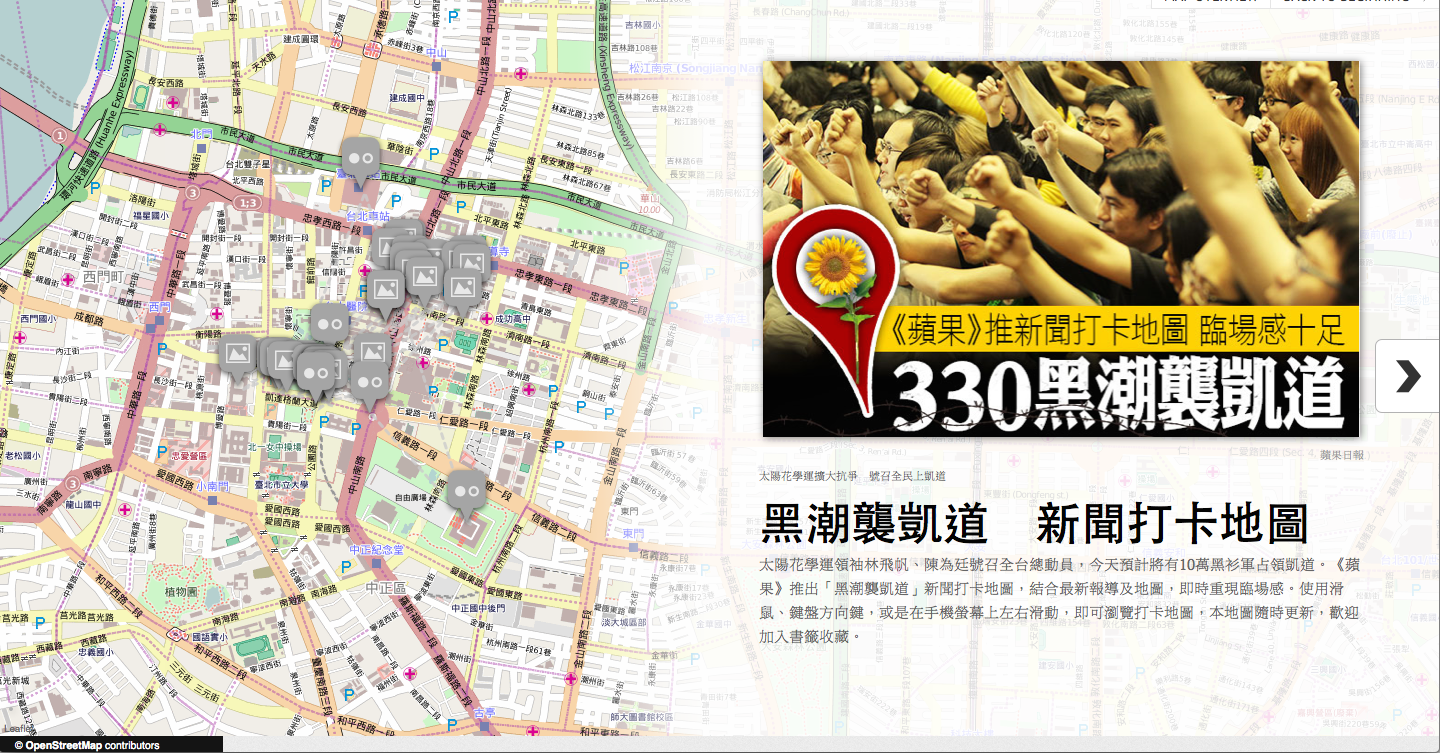
From 新聞打卡地圖,蘋果互動新聞圖表
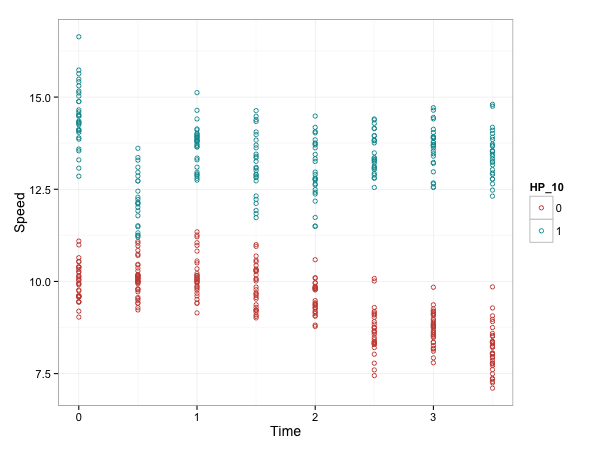
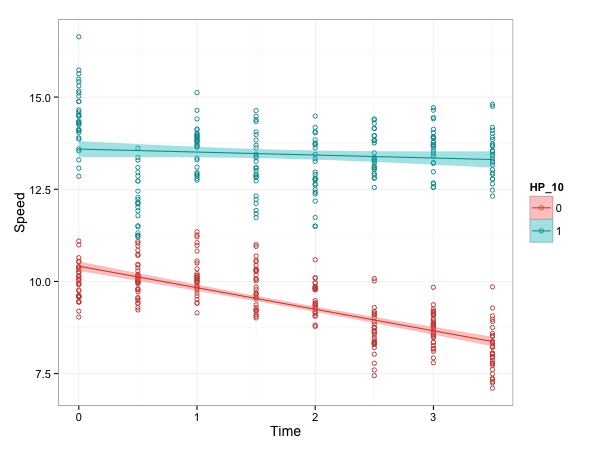
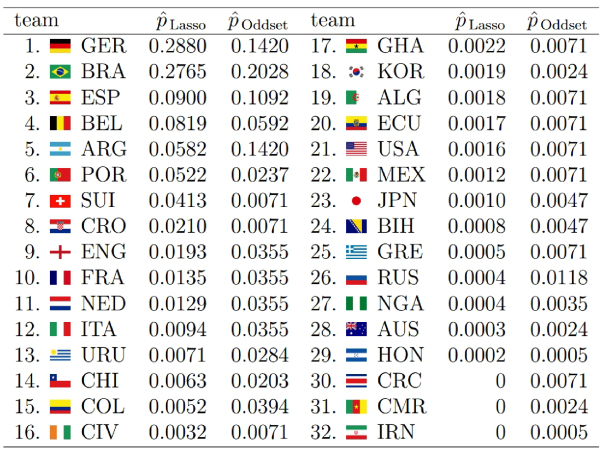
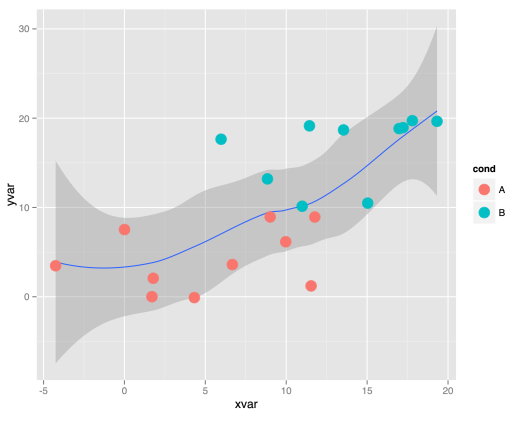
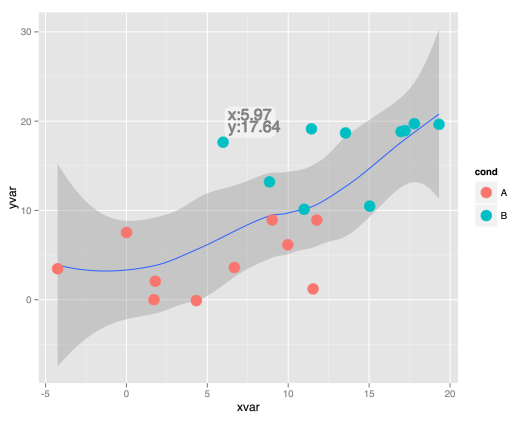
linear model
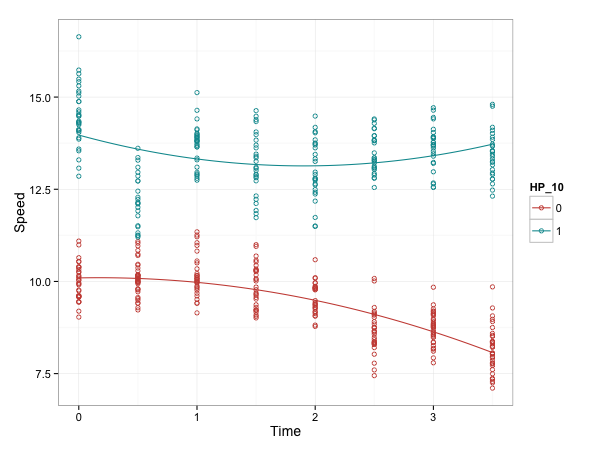
quadratic model

... WAIT! Are you sure that's the article about?
From http://www.naturalnews.com/042112_TED_conferences_pseudoscience_GMO.html
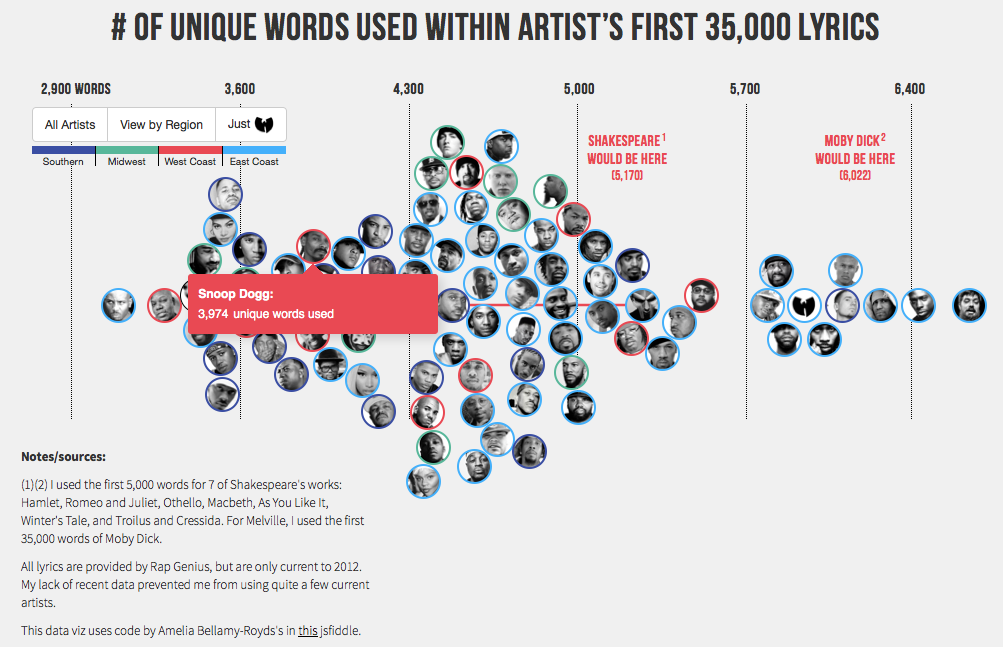
From http://rappers.mdaniels.com.s3-website-us-east-1.amazonaws.com/
Web and browsers dominates our front-end world.
Almost every PC and mobile have a modern browser today.
← SVG / HTML5 Canvas