王亮博 (亮亮)
shared under CC 4.0 BY
Esc to overview
← → to navigate
Online slide on http://ccwang002.gitcafe.com/ChinaRConf-Interactive-Vis/


My honor to be the first in this section. This is an introductory talk.
Web and browsers dominates our front-end world.
Almost every PC and mobile have a modern browser today.
← Hope SVG here someday

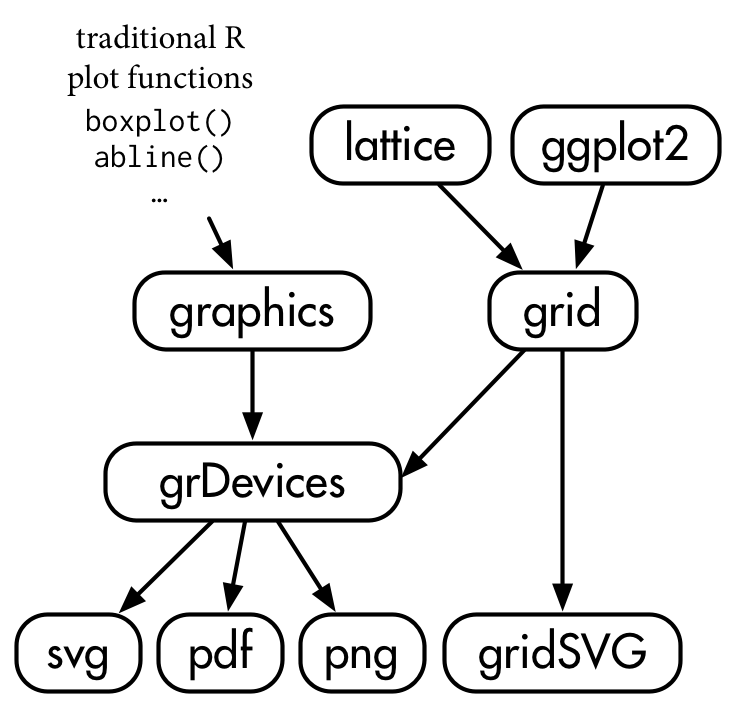
library(grid)
grid.newpage()
pushViewport(plotViewport(c(5, 4, 2, 2)))
pushViewport(dataViewport(
  pressure$temperature, pressure$pressure,
  name="plotRegion"
))
grid.points(
  pressure$temperature, pressure$pressure,
  name="dataSymbols"
)  # upper figure

grid.rect(gp=gpar(fill=0))
grid.xaxis()
grid.yaxis()  # lower figure


grid.edit("dataSymbols", pch=10)
upViewport(1)  # inner
grid.rect(gp=gpar(lty="dashed", fill=0))
upViewport(1)  # outer
grid.rect(gp=gpar(lty="dotted", fill=0))
# upper plot

downViewport("plotRegion")
grid.text(
  "Pressure (mm Hg)\nversus\nTemperature (Celsius)",
  just="right",
  x=unit(250, "native"), y=unit(600, "native")
)
# lower plot


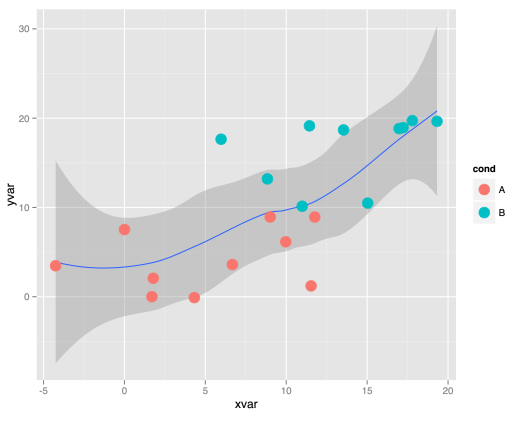
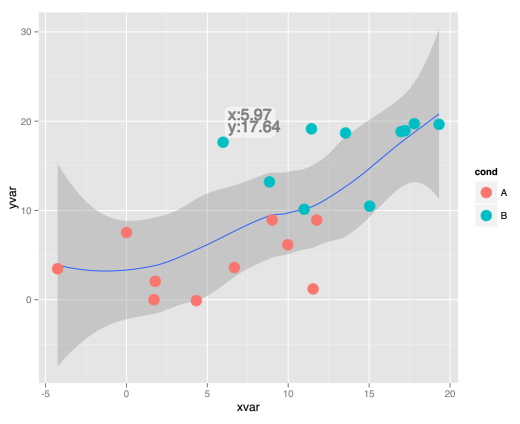
Direct SVG Result